AGW and
Arrhenius | 2011VII3
| UniverseHistory
by BellDharma |
Introduced @INTERNET 21Sep2008 |
This page Latest
Updated Version 2011-07-14 | YearMonthDayTime
content
· webFindText on this page by Ctrl+F · AGW-Deniers’ Plateau
Simple and direct AGW-mathematical
explanation — No AGW-Modeling or Simulation — also explaining why the modeling fails to explain AGW in
detail

PhotoSource:
Authors archive · NikonD90 · Details · GLOBAL WARMING · BellDharma in 2Jul2011
|
|
|||
|
|
|
|
|
|
|
Hello everybody. My Acronym is BellDharma. This is a (special) web page about
global warming launched 4Jul2011.
Those of you who eventually are familiar
with the Swedish website platform in Universe(s)
History,
more precisely the »AGW-thread», will find this document a (short)
summary to that part — with some additional material. Some of the text here
connects to it. Its Swedish counterpart in this htm-document is found in Den Globala uppvärmningen —
matematiska samband.
For the rest of the text, I hope »the Swedish audience» will enjoy the English
part too (Swedes in general [after
WWII, for which I am ashamed]
are pretty good Englishmen). Thank you very much.
Preface
AGW holds. You are safe. You are home. But
the modern academic scientific community never was able to EXPLAIN why and how.
Instead a »the mean academic» appeared (around Jun2011), pushing »the kids»
away BECAUSE they asked, never taking an open discussion, always demanding
arguments to be settled in a way before even mentioned. Here you will be safe
from such tyranny.
In this document, you will be introduced to a short visit to the (very)
simple AGW-math-basics — that »the mean academic» in principle always HAD the
opportunity to show you, and me, but never got in to the core of in the
expedition of grasping the essence: That knowledge is a FRIEND of the peaceful,
of the asking. Not an enemy. Science, understanding, ability to explain, is
settled not by consensus, political opinion, but by knowledge, ability to
relate, show, guide and acknowledge; Knowledge is inclusive, not exclusive.
Also the errors are explained. There is no inventions of math in knowledge,
just pure deduction. If you find that something does NOT hold, you are
perfectly right. To find out HOW, is called (the philosophy of) science. Modern
academy has obviously developed something else — now more luminous than ever.
Introduction
The mathematical explanation to AGW — the mathematics of anthropogenic global
warming
— is seen to connect to a mathematical
proof of AGW
in describing the difference in the mathematics of Arrhenius and AGW. In the following it is shown how the
mathematics of AGW
and Arrhenius’
logarithmic functions coincide (by giving specific offsets to Arrhenius’
curves) and how the latter give good approximations to the more precise mathematics of AGW, which however [Jun2011] seems
unrepresented in modern quarters. The presentation yields a solid example of
the mathematical
validity of AGW,
giving a simple and elementary simultaneous but thorough explanation of anthropogenic global
warming by mathematics.
In AGW-beviset, extensive references have already been
exposed with consistent results from research groups (Hansen et al 2005). These
are also mentioned in the additional results by B. Lin et al 2010, included in this document, with further
well known connections to the general IPCC-presentations [See IPCC-link on top
of the document in AGW-beviset].
The AGW-proof in mathematics is based on
three derivative-integral connected curves (which I am sure you most presumably
already have a certain familiarity with, to some extent):
The image [original
size location] links to a more (complete, extensive) descriptive compilation
with additional vertical scales from the actually known and observed functions
(yet Jun2011 only in Swedish).
These three derivative-integral functions are
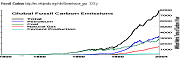
1. CO2-concentration
(top above),
2. temperature-Energy
feeding (middle, connecting to the global warming measured NASA-curve together with the industrial
fossil-carbon
emission curve), and
3. heat-content
(bottom, W/M², »Ocean Store»).
For the mathematical proof however, it
is sufficient to know (depart from) only the mathematical expressions
themselves (in these three functional curves) — type »I found them while
running in the woods» would be sufficient. HOW they came to appear would be of
a less important party, nothing to impress on the validity itself. That part is
given (yet Jun2011 only in Swedish) in AGW-beviset. For a first fast insight, we set out directly
on the (found) expressions in order to study their connection to Arrhenius math
and their already well established preferences.
See a first (summing) short form of the
above in
with further details in this document
from Basic
AGW-math.
BellDharma 2Jul2011
.
Simple and direct AGW-mathematical
explanation — No AGW-Modeling or Simulation — also explaining why the modeling
fails to explain AGW in detail

ImSource: Authors archive ·
Summer26Jun2011 · NikonD90 · Detail · GLOBAL WARMING
Simple
and direct AGW-mathematical
explanation
No
Modeling or Simulation requested — these are contained as special aspects
by BellDharma 2Jul2011
»The logarithmic mathematics of Arrhenius»
generally [Jun2011] appears as the one and only basic agency in making
mathematical enquiries on »explaining global warming» in the scientific
community. It has also become »the Achilles’ heel» in all AGW-discussions
(Anthropogenic Global Warming): dead-end discussions only enhancing
(developing) bitter hostility and rivalry (and ideas of revenge, and also
punishment). The reason why is simple to see and understand — once we know HOW
certain central (3 »simple») mathematically formulated curvatures give solidity
to the entire AGW-complex, how the curves and their expressions do explain the
Arrhenius-modeling math results (from all [respected] research
groups as well, as these anyway all point to one and the same principle
IPCC-resulting picture)
— in a simple and elementary view (click for larger view with brief
description):
The image [original
size location] links to a more (complete, extensive) descriptive compilation
with additional vertical scales from the actually known and observed functions
(yet Jun2011 only in Swedish).
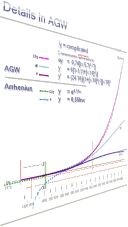
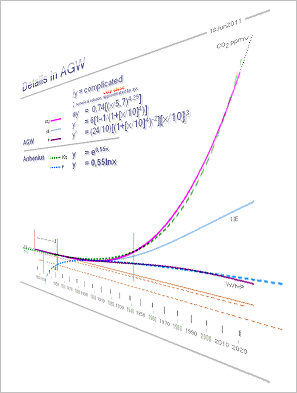
In
short: All three solid curves are from top to bottom derivatives and from
bottom to top integrals explaining one mathematical-physical process of energy
distribution — AGW, fed by the central industrial fossil-carbon emissivity.
TOP
CURVE describes the CO2-concentration within 98%
of the measured values, MIDDLE CURVE describes the central driving energy mechanism
to AGW, the industry fossil-carbon combustion complex, it connects to a
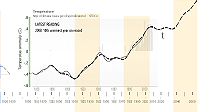
corresponding smoothed sea version of the heat uptake together with natural sea
variations, forming a direct match to the resulting observed NASA-curve
we identify as our criteria of Global Warming, and BOTTOM CURVE the actual
effect (power in W/M²) with which AGW proceeds at the present. Brief (shorter)
descriptions explain the details as tabled below. A detailed description of how
the different mathematical expressions are deduced is given (as yet Jun2011
only in Swedish) in AGW-beviset.
As seen from the comprehensive figure above
and its consistent quantitative results, what Arrhenius’ math does not contain,
and what (hence) creates the dead-end emerging »Achilles’ heel» in all
AGW-discussion, is the central driving temperature-Energy [t|E]-function. It is
[See B.
Lin et al 2010
p1937t Fig 2] simulated in the scientific community (never deduced), and
neither has, nor can be given, a mathematical connection inside the Arrhenius
expressions often termed »the Arrhenius greenhouse law». The three connected curves in figure
have [as yet Jun2011] no mentioning in the scientific community. As we see, the
Arrhenius curves (dotted) are close approximations — provided they are given
appropriate (modeling) offsets, however still in lack of the central explaining
t|E-function. »Simple math».
BellDharma 2Jul2011
.
DEN GLOBALA
UPPVÄRMNINGEN — AGW — GLOBAL UPPVÄRMNING — Matematiskia
Samband — AGW
— Proofs in Anthropogenic Global Warming · INLEDNING
DEN GLOBALA UPPVÄRMNINGEN · Inledning
BILDKÄLLA: Författarens arkiv ·
14Maj2011 · Nikond90 · Detalj — GLOBAL UPPVÄRMNING · matematiska samband ·
Summering från AGW-beviset
DEN GLOBALA UPPVÄRMNINGEN — Matematiska
Samband
av
BellDharma 1Juli2011
Den förklarande/beskrivande
AGW-matematiken och den (sedan slutet av 1800-talet) etablerade Arrhenius-matematiken
har ingen gemensam grund. Men Arrhenius logaritmiska samband — som används av
etablerade forskargrupper i olika klimatmodelleringar och simuleringar — ger
goda approximationer till den uppenbart i det närmaste exakt beskrivande AGW-matematiken,
och förutsatt Arrhenius-kurvorna ges tillbörliga offsetvärden:
AGW-kurvorna
[heldragna] räknat uppifrån [CO2] och ner är varandras derivata, med den
centralt drivande [industrins fossila kolutsläpp, havsversionens
upptrögade, utslätade, version] temperatur-energifunktionen i mitten. Denna
ingår inte i Arrhenius CO2-naturliga variationsmatematik. CO2-värdena
[ljusvioletta] stämmer in till 98%
med uppmätta värden. Energikurvans vertikalskala beskrivs utförligt i Energikurvans vertikalskala.
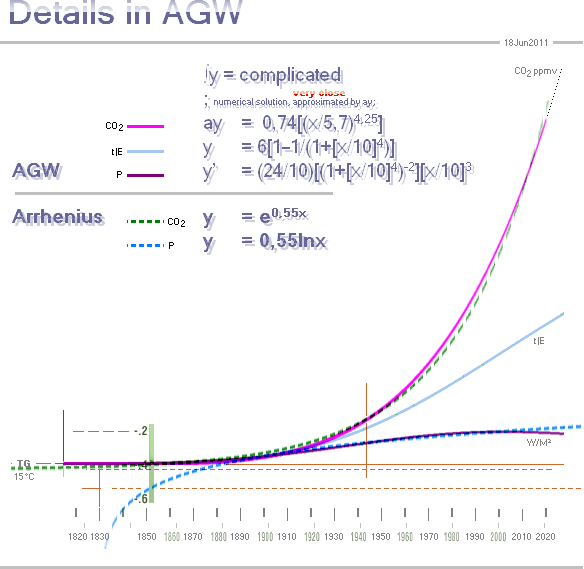
Image links to a more
(complete, extensive) descriptive compilation with additional vertical scales
from the actually known and observed functions (yet Jun2011 only in Swedish).
Den centrala t|E-funktionen [Se Man Made Global
Warming],
tillsammans med den
förenklade havsperioden, ger en alldeles tydlig ekvivalent komponentsumma med
den uppmätta NASA-kurvan — den enda kända typ (med olika varianter beroende på
medelvärdesperioder) som vi associerar med begreppet global uppvärmning:
y = 6[1-1/(1+[x/10]^4)]
+ 0.222(0.9[(2cos (pi x/1.48)) + 0.5(cos (3pi[x-0.1]/1.48))]),
or the corresponding now-year-based connection as
(dotted below)
t(NASA)
= –0.4
+ (1.765)[1–1/(1+[(YEAR–1815)/212.7]^4)]
+ 0.0653(0.9[(2cos pi (YEAR–1880)/31.48)+0.5(cos
3pi[YEAR–1880-0.1]/31.48)])
Men sambandsformerna, trots uppenbart
överensstämmande och därmed tydligen prediktiva med direkt bevisbar jämförande
referens från ca 1860 till nu, omnämns inte i den etablerade
vetenskapslitteraturen.
Uppgifterna
bekräftas med samma principiella kvantitativa resultat från fristående
oberoende forskargrupper.
Det närmaste vi kan komma är här
veterligt en nyligen (30Jun2011) upphittad och alldeles tydligt samhörande
typografi från olika forskningsgrupper som framställt olika modellsimuleringar
på Arrhenius matematiska bas; Speciellt tydligt framgår det i referenskällan B. Lin et al 2010 (s1926-1927 Fig 2, motsv. t|E-kurvan,
NASA-kurvan och W/M²-kurvan) där också de redan kända Hansen-referenserna (2005) med flera omnämns i samstämmiga
kvantiteter. Alla kvantitativa data (även generellt för IPCC, se från AGW-beviset) tycks alltså vara samstämmiga.
Men
den beskrivande, sammanfattande, matematiken tycks vara frånvarande i moderna
kvarter.
(Om den ställs fram är det först och främst tydligt att allt
AGW-förnekeri upphör, effektivt och med omedelbar verkan: en komponentekvivalent
är ingen teori, ingen hypotes. Den är ett bevis. Det finns, uppenbarligen,
ingenting att diskutera i den frågan).
BellDharma
.
AGW
aGlobAlwarming
by
BellDharma 25 Jun 2011-06-25 [GMT+1]Solar[GMT+2]Industry@21:30
As notified (from) on 20 Jun 2011:
ImSource: Authors archive ·
Spring14May2011 · NikonD90 · Detail
Basic
AGW-math
by
BellDharma 25 Jun 2011-06-25 [GMT+1]Solar[GMT+2]Industry@12:00
Below is shown all the active
principle functions appearing
in the complex of global warming — as here presented by RELATED MATHEMATICS AND
PHYSICS.
— RELATED MATHEMATICS AND PHYSICS is
what we can, and must, be capable of explaining, by complete logic, for any
person to understand, by a detailed path of reasoning, without any
INSTITUTIONAL INVENTIONS OF LOGIC or AGREEMENTS leaving individuals outside the
community of Natural Science, only that which HOLDS, and besides that, noting
at all. Errors are removed quickly and elegantly by the fact of being not understandable
to YOU, not explainable, not relatable, not verifiable.
These functions show two groups: The AGW-group (top); The
Arrhenius-group (bottom).
But, while the Arrhenius-group, the dotted curves below, is well
represented in Modern Academy
(MAC) by »radiative forcing», the AGW-group has no representation: it is not
mentioned, not argued, seemingly completely unnoticed.
|
Dotted
curves
(green, blue), modern academy with Arrhenius expressions — lies outside a
complete explanation, but makes »good approximations» with specific offsets —
except for the central t|E which is excluded. Solid
curves
(light violet, light blue, dark violet), the actually related
mathematical-physical explanation, unrepresented in Modern Academy (MAC). Specific matches to 98% of carbon-dioxide
concentrations (top) is given from the corresponding sea-smoothed industry
fossil carbon (middle, derivative of the former, the central
temperature-Energy curve), giving the actual heat effect (power, bottom,
derivative of the t|E-curve, actually connected to the ocean heat uptake).
See compiled illustration with sources.
The central and, in the science community, unrepresented aspect was
certified 1992 by Richard Lindzen in this short quote: ”Consensus
and the Current "Popular Vision'' Many
studies from the nineteenth century on suggested that industrial and other
contributions to increasing carbon dioxide might lead to global warming.
Problems with such predictions were also long noted, and the general failure of such predictions to explain
the observed record caused the field of climatology as a whole to regard the
suggested mechanisms as suspect.”, CATO
Institute — Global Warming: The Origin and Nature of the Alleged Scientific
Consensus, Richard Lindzen 1992 http://www.cato.org/pubs/regulation/regv15n2/reg15n2g.html A
more comprehensive figure with vertical scales of the different quantities is
given in Effect and Energy in AGW
[as yet Jun2011 only in Swedish]. All quantities are given by already well
known, established sources. The two upper curves form a collective synthesis
with established sources as shown in The 6 Curves
(click to see the original),
|
— Is there anybody
here having a hard time with »simple» mathematical physics? |
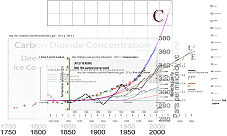
Image right links to a
more (complete, extensive) descriptive compilation with additional vertical
scales from the actually known and observed functions (yet Jun2011 only in
Swedish).
See also more in depth
Man Made Global
Warming for
details in the AGW-group.
BellDharma
.

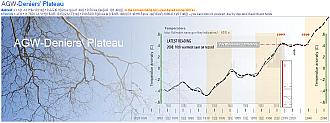
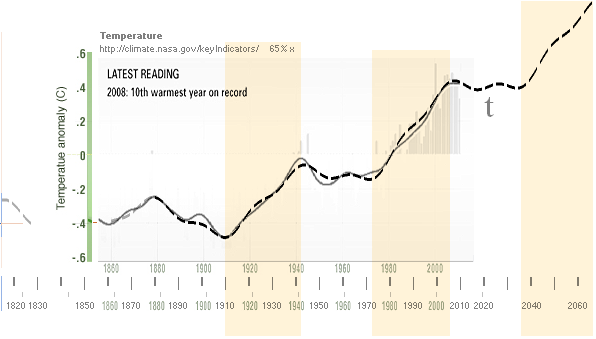
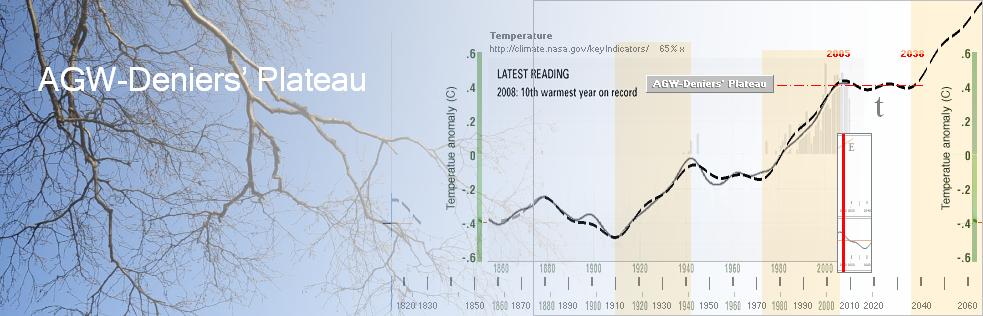
The Deniers Plateau — 2005-2038
by BellDharma
20 Jun 2011-06-20
The situation depicts, obviously, a directly dangerous
situation for science as a credible community.
For sake of
reference;
— Take a look at »the deniers plateau», the present
global warming period ca 2005-2035 with respect to the predictable NASA-curve (the dotted match) in
http://www.universumshistoria.se/AAAPictures/AGW1.htm
as described in ManMade
Global Warming and Basic AGW-math
from industry + natural sea variations [See also B. Lin
et al 2010, the same principle result by simulation]:
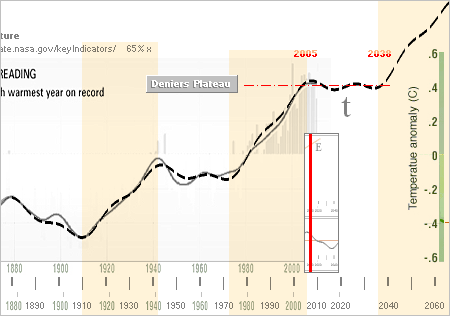
Image (right) above
http://www.universumshistoria.se/AAAPictures/PNG/DeniersPlateau.PNG
detailing the actual Deniers Plateau with sources as
given at the NASA-curve.
With the same type of matching and predictability as certified
from 1860 up to now, we are now [Jun2011] in »a flat period» spanning roughly
between 2000-2040:
No bigger
changes will be seen within a direct practical average measure in global
warming during the period 2000-2040:
The sea period is [now, 2011] going down, all the way to ca 2040 —
as it did the preceding period 1940-1970 — while the actual global warming
curve (t|E) continues up, all with a total net
canceling out. Nothing happens.
Inevitable
Result:
— A net
»Lindzen-Christy affirmation: no bigger changes».
Deniers WILL increase (exponentially).
It is their »proof». Deniers Heaven: nothing happens.
— We are NOW about to hear that for the
next near 2040-2011=29 years. A whole new generation.
— Are you prepared for that?
I’m not. (Public opinion will KILL »the scientific community» — most
probably thoroughly too, my personal interpretation — unless »THE DENIERS
FRAUD» is uncovered).
The Deniers
Plateau will, unless exposed, outnumber The Science Community (in global
warming) by general denialist public opinion — in (say) ten years, not to say
in twenty. As a consequence, eventually nothing will be done to avoid the
coming — the unavoidable steep heat-wall beginning from around 2040.
That is
(obviously) what the deniers »want» — with all their might.
— Unless a solid stand will appear now — NOW — it
eventually means this present year history
i s »the denialist’s
overtaking».
— The deniers’ opinion (all obviously based on pure
»complicated ignorance»), is apparantly about to cause a general human
catastrophe, unless the fraudulent character of the denier will be settled,
once and for all.
Example (25Jun2011, Anthony Watts) — all marked text
my notation:
“The
End is Near for Faith in AGW”,
http://wattsupwiththat.com/2011/06/25/the-end-is-near-for-faith-in-agw/
(13Jun2011, Kathleen McKinley)
”No Global
Warming In The Last Ten Years”,
”Sadly,
politics has infected science, and we don’t know who to trust anymore.”,
http://blog.chron.com/texassparkle/2011/06/no-global-warming-in-the-last-ten-years/
Typically:
”If we would only cut carbon emissions,
then everything will be OK. Will it? If that is true then why doesn’t the rise in earth’s temperature
track with the rise in CO2 emissions over the last 10 years? CO2 emissions keep risking,
but the
temperature hasn’t.”,
Matthew Wilson @BraveNewClimate28Jun2011
http://bravenewclimate.com/2011/06/24/clearing-up-the-climate-debate/
- comment-130532
The scientific community cannot meet such
arguments-questions — because the central energy driving AGW-function — the
actual temperature-energy curve that KILLS the above argument [detailed here in
Man Made Global Warming] — is excluded
in the Arrhenius math adopted base: such a
mathematical-physical foundation does not exist. Meaning: Science is
outnumbered. See further in Basic AGW-math.
How do we
answer Matthew Wilson?
— Because the
actual temperature measure is composed of the actual up going temperature raise
and a down going natural sea period (now 2000-2040), these cancel and will do
so until about 2040 where a steep raise will follow similar to the period
1970-2000. Meantime, the CO2-concentration
will continue to climb steeply upwards by exact predictive power along
with additional contributions. See for yourself.
The scientific community cannot give this
answer, because the central temperature function can only be simulated, not
deduced, from the basic Arrhenius mathematical foundation being the entire
mathematical basis of the scientific community. The academic community has no
other explaining, scientifically established based tool, and that tool is
insufficient, no matter its approximate overwhelmingly closeness. The central energy-temperature
function is missing, effectively excluded by the Arrhenius mathematical base.
The skeptic is asking for a proof the scientific
community does not have — not because it doesn’t exist.
Because SCIENTIFIC COMMUNITY in general and
ditto WEB SITES in explicit [Jun2011] only take discussions based on Peer
Review references, there is neither a way for the simple observation to enter
into the modern scientific community. [»We don’t accept other views than those
already seen»]. Tough days.
Unless dealt with: The deniers will
continue their agenda all the way to 2040, while the scientific argument will
weaken: no temperature change. Then as we can se, from ca 2040, comes »the
great shock», the steep raising temperature increase when the ocean period
begins upwards again together with the raising t|E-curve. Not only the deniers
will (most probably) become victims from even more harsh weather-climate
conditions, but also all the others as a worst case scenario. But then it is
too late — and the deniers didn’t care anyway.
But where is this highly clarifying predictability
match shown in public?
UtellMe.
You are the
consulted experts.
— This is obvious to me: once the
deniers will catch a glimpse of the simple proof, the predictability, the
match, the simple and easy-to-understand connections (even to a 4:th grader)
collecting all data under one and the same roof, the deniers will vanish,
disappear, drop off, like the natural healing on a bad wound.
Science will win this, knowledge will do it — but not on account of a
single person.
— A ”march to the halls of government” is noble, respectable,
admirable. But science has a better, more effective tool. It is called
knowledge.
BellDharma
.
GLOBAL WARMING
|
Man Made
Global Warming by BellDharma 19 Jun
2011-06-19 Yes. It is definitely man-made. Let us see why. The reason any one of us — capable of performing basic calculations in
mathematical physics — can know why we certainly are on the right path in
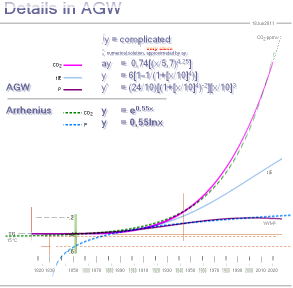
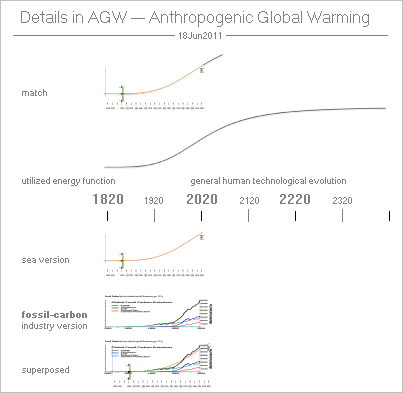
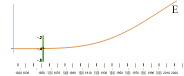
addressing Global Warming to Anthropogenic causes, is this: With a general human evolution of technology (illustrating image as below, details
in AGW, the energy curve basic function as y=a[1–1/(1+[x/b]^n)], n=2, its
derivative gives the effect [power] transient [ocean heat absorption, value
0,878 W/M² period 2000-2010, fairly in accord with other sources (Hansen group 2005), also in line with
a more simple evaluation from Stefan-Boltzmann-radiation law, provided a correct
interpretation], its integral gives the carbon-dioxide concentration
[yielding a 98% match with measured values up to 2009, and further], both
latter as long as t is added by fossil-carbon) utilized
energy function
Image above http://www.universumshistoria.se/AAAPictures/PNG/DetailsInAGW.PNG Fossil-Carbon curve (black) from WIKIMEDIA COMMONS and
RENEWABLE ENERGY — Critical Evaluation of the U.S. Renewable Energy Policy,
2009, respectively http://commons.wikimedia.org/wiki/File:Global_Carbon_Emission_by_Type_to_Y2004.png http://www.renewableenergy.typepad.com/ it is IMPOSSIBLE to omit an additional temperature
component (t) from a general fossil-carbon combustion temperature (T) from an
emitted (combusted) amount (m) of the fossil carbon into the local
atmospheric mass locale (M), account taken upon a general emissivity or
absorption coefficient (a), simply expressed as giving t = Ta(m/M) [Temperature and Energy are proportional — as in the
familiar General Gas Law: pV=kT=E giving T=E/k]. With account taken for thermal resistance (R=t/P, P the irradiating power from the Sun: t
catalyzes a thermal resistive increase from the already given irradiating
Solar power) the expression enhances to yield for a double t := 2Ta(m/M) [As long as a T exists (for fossils roughly around
2000-2200 °C), also a t inevitably will follow. But with no T (or a very low
negligible value of it), also no t will be added: zero AGW]. |
|
With the given industrial fossil-carbon curve and
its adopted mass-scale to fit the general energy-curve (E), m/t can be
calculated [adopted value from 2005 as (average yearly scale base) 10.17094
T12 KG/°C, T for 10^+, with the reported yearly ca m=7 T12 KG fossil carbon
to the measured total GW of ca t=+0.7°C], and (with a general Earth-based
a=0.7, meaning ca 0.3 albedo) also M can be calculated [value 3.52138 T16 KG
to be compared to the total atmospheric EarthM=5.3 T18 KG]. With simple figures [density at STP (Standard
Temperature and Pressure) everywhere the same] M holds only at most h=60
meters above the solid Earth-surface to account for the measured t(AGW)-curve
— which (hence) excludes any AGW-debate on higher
lying atmospheric layers (type
Christy’s arguments, but also Lindzen’s »climate sensitivity»): these
may (and do) contribute, but have no significance in the AGW-basics. With a 50
pixel graphical square unit to draw from, and taking a more or less »simple» ocean (two-complex)
period of type (cosx)+(cos3x) [coefficients
must be added to get a scaling match to the other given curves]
together with the basic t|E-smoothed fossil-carbon component, in all y = 6[1-1/(1+[x/10]^4)]
+ 0.222(0.9[(2cos (pi x/1.48)) + 0.5(cos (3pi[x-0.1]/1.48))]), or the
corresponding now-year-based connection as t(NASA) = –0.4 +
(1.765)[1–1/(1+[(YEAR–1815)/212.7]^4)] +
0.0653(0.9[(2cos pi (YEAR–1880)/31.48)+0.5(cos 3pi[YEAR–1880-0.1]/31.48)]) we have the
dotted (5) from the already known and well recognized sources (as) given in
As far as
here understood, this is the only (typical) exact proof of AGW that possibly
ever will be seen. Note that the matching between the solid (measured) and
computed (dotted) has variations depending on the local conditions given to
the term »global average», and the degree of details in the measured
observation. y = 6[1 – (1+[x/10]4)–1] + 0.222(0.9[2cosπ[x/1.48]
+ 0.5(cos3π[x–0.1]/1.48)]) dotted
NASA-curve correspondent
http://www.universumshistoria.se/AAAPictures/AGW1.htm
http://climate.nasa.gov/keyIndicators/ http://www.cru.uea.ac.uk/cru/info/warming/ is reduced to 65% horizontally to match the time
scale of the Fossil-Carbon curve; The
Fossil-Carbon vertical scale is then reduced to 33%
Original
at WIKIMEDIA COMMONS: http://commons.wikimedia.org/wiki/File:Global_Carbon_Emission_by_Type_to_Y2004.png Also
(with others) RENEWABLE ENERGY — Critical Evaluation of the U.S. Renewable
Energy Policy, 2009: http://www.renewableenergy.typepad.com/ to match (a closest possible approximation to) the
(t|E)
The pure temperature/Energy curve
given from the corresponding industrial Fossil-Carbon emissions curve as
given at http://commons.wikimedia.org/wiki/File:Global_Carbon_Emission_by_Type_to_Y2004.png http://www.renewableenergy.typepad.com/ (greatly smoothed as seen by the great
oceanic heat-inertial volume)
The (simplified) surface ocean period curve, partly detailed in
http://icecap.us/docs/change/OceanMultidecadalCyclesTemps.pdf ICECAP
(International Climate and Environmental Change Assessment Project
2007-2008), Ocean
Multi-Decadal Changes and Temperatures, Joseph D'Aleo; Authors
references at http://icecap.us/index.php/go/experts = NASA-curve
vertical scale (solid NASA, dotted E+SimplifiedSea).
As is clearly seen, the matching »automatically»
makes »a self proving predictive power» — however no account taken upon
additive (radiative forcing) components (making the figure even worse); There is, then, only one known agent to account for
the measured Global Warming: industry. Safely. Exactly. Precisely. Man made
global warming. There is no point in this universe of ours as I know capable
of showing me else-way. Christy and Lindzen
give wrong arguments (causing public chaos) because they do not account for
the (unnoticed but simple) math-base (t/T-form) making up (an unmistakable
equivalent to) the measured NASA-curve: the industrial fossil-carbon driving
the whole (land-marine max height=60 meter) measure. Radiative Forcing high above the Earth surface is explicitly not
within the basic AGW-proof (the t/T-form giving a max h=60M), and therefore
makes no contribution to the clarification of the AGW-quest itself. (Debates
on the subject, not distinguishing the different aspects, make dead-end
discussions). AGW is no
natural variation AGW, a non natural phenomena, cannot be explained by
the general math referred to as Arrhenius’ expressions (often termed
»radiative forcing» and associated with the higher atmospheric layers): there
is no driving energy function in Arrhenius natural math. To explain (mathematically) for AGW, a strict
isolated mathematical-physical complex must therefore be found (»no Arrhenius
math»), including all the seven (7)
known ingredients to the observed (A)GW-complex — and too, it must include »Arrhenius curves» as a special case
if given specific offsets. And so is also the case, indeed (See Sw. ed. Den Globala Uppvärmningen).
Image above: Arrhenius’ expressions (dotted)
included by specific offsets in the simple t|E-complex (solid). Extensive details in http://www.universumshistoria.se/AGWbeviset.htm
- AGWbevisetDel3 See also article Basic
AGW-math in this document . That is what the simple
t/T-connection does — with a seemingly fine alignment to
already presented figures. A precise and in depth description of the
mathematical expressions, how they are deduced, how they compare with present
[up to 2010] research and modeling concepts, is given (as yet Jun2011 only in
Swedish) in http://www.universumshistoria.se/AGWbeviset.htm. BellDharma |
|
. |
HoaxersPage ·
TheFinalCountDown · by BellDharma 2011-07-03 | YearMonthDayTime
SkandalSidan
— för folk i farten
HoaxersPage
AGW-Deniers’
Plateau
dotted:
y = 6[1-1/(1+[x/10]^4)] + 0.222(0.9[(2cos (pi x/1.48)) + 0.5(cos
(3pi[x-0.1]/1.48))]); or
the corresponding now-year-based connection as
t(NASA)
= –0.4 + (1.765)[1–1/(1+[(YEAR–1815)/212.7]^4)] + 0.0653(0.9[(2cos pi (YEAR–1880)/31.48)+0.5(cos
3pi[YEAR–1880-0.1]/31.48)]) — you can follow it yourself, day by day and check
that it holds
”If we would only cut carbon emissions, then
everything will be OK. Will it? If that is true then why doesn’t the rise in earth’s temperature
track with the rise in CO2 emissions over the last 10 years? CO2 emissions keep risking, but the temperature hasn’t.”,
Matthew Wilson @BraveNewClimate28Jun2011
http://bravenewclimate.com/2011/06/24/clearing-up-the-climate-debate/
- comment-130532
Matthew’s
observation is — obviously — just and correct.
But
so is also AGW.
—
Attempts AT PRESENT from the academic scientific community to MEET Matthew’s
observation with an EXPLANATION just WORSENS THE SITUATION — because the
scientific community AT PRESENT has no mathematical component with which to
satisfy that Quest: Arrhenius’ basic logarithmic-exponential expressions,
the only mathematical
tool known to the scientific community AT PRESENT to meet global warming
calculus, does not cover the answer. But a just
answer does indeed exist.
It seems you are deluded — together with
a constantly growing crowd, these days [Jul2011].
With exactly the same predictable power
as the match (dotted, also link below) holds from 1860 to now, we are in a
period (2000-2040) where the natural down going sea period practically cancels the up going global
warming caused by the industrial fossil carbon emission, giving a flat plateau of
about 40 years duration, see (f.ex.) compiled already well known established
sources in
http://www.universumshistoria.se/AAAPictures/AGW1.htm
Most so called deniers or skeptics refer
to this present flat level as a PROOF there is no global warming: no
temperature raise, but a still up going increase in CO2. This is also in
perfect accord with the three derivative-integral functions explaining the dotted match, but of
which (especially) the so called deniers seem particularly unaware. If you want
to carry on with that legacy to your children, that will be your choice and
your responsibility. On my account, I choose to select a more conservative
attitude as I realize the steep coming heat-wall from around 2040 — similar to
the period 1970-2000 called »The Great Pacific Climate Shift» [‡1], no account taken on additional
components (permafrost). Forty years. That is, obviously, the available time
humanity has to make a cure, if possible. And there obviously is only one train
to catch. It is, obviously again, spelled: Departure NOW.
Hoax? Could you please develop that more
in detail?
In the record of human history, you have
a great opportunity in engraving the meaning of the concept of being SMART. You
can use this opportunity. Or you can pass it to a future generation.
But
the worst of all is this:
—
Look how the academic scientific community MEETS Matthews Quest: he is about to
be THROWN OUT, not to say he, the Quest by itself, is DIRECTLY DEROGATED by the
actual MODERATOR, appearing as »God’s Right Hand». That is the worst of it all;
There is, obviously, no open discussion — no open knowledge — in today’s
»science». The academic community itself, obviously, generates the disturbing
ghosts it claims everything else to be responsible for in this AGW-turbulence.
[And more is to follow ...].
ANOTHER
OBSERVED ISSUE in academic community, obviously, is this one:
—
CAPITALS ARE NOT ALLOWED in posts, comments, in some Academic Web Sites —
because, and hear this heaven and earth, it is apprehended as SHOUTING. Not
emphasizing by using the only simple and direct advanced tool there is to make
a FOCUS by script. Keyword. Programmers use it frequently, and effectively
[Compare Borland’s DELPHI from version 1 and on with Windows API, to give a
known example].
—
And so it goes on, and on, and on: The modern academic community seems
interested in everything — except THE POINT. It never gets to it. Deleted
because capitals, OhMyGaad. Humanity obviously is in acute need of a new
scientific community, worthy the name.
Se also
————————————————————————————————————————
page 1 bottom of
http://icecap.us/docs/change/OceanMultidecadalCyclesTemps.pdf
Inledning
AGW-beviset behandlar genomgången av de olika
partierna i detaljerad (fullt uttömmande) mening. Den här presentationen utgör,
till viss del, en summering baserad på delvis nyligen upphittat material (Se B. Lin et al från 2010) som bara bekräftar det redan
framförda (den allmänna kvantitativa samstämmigheten i ämnet AGW).
Med ev. vidare från GLOBAL UPPVÄRMNING —
matematiska samband.
References
Anthropogenic
Global Warming
Several (many) webSources use the term
AGW for »Anthropogenic Global Warming». But few (if any, still looking Jul2011)
seem to derive the actual historical passage as to when and where it came
about. Perhaps nobody can tell — except WE who were there around 2000 and the
following decade. Direct historical records are found on the Web under Climate
History and Climate Change.
”Arrhenius's
greenhouse law
for CO2”,
WEATHERQUAKES, EARTHQUAKES, MATHEMATICS
AND CLIMATE CHANGE (2008)
http://www.colorado.edu/math/earthmath/1s.pdf
TOA — abbrev. TopOfAtmosphere:
”
Since there is almost no heat storage
change within the atmosphere and land at
annual time
scales owing to their negligible heat
capacity and temperature
change, the TOA net radiation
or the imbalance should
be the same as ocean
heat storage change.
Actually, the measurements
of interannual variations of TOA net
radiation and
ocean heat storage are found to be very
consistent
(Wong
et al., 2006). From the ocean heat
storage measurements, the
TOA net radiation can
be inferred as about 0.85 W/m²
(Wong
et al., 2006; Willis et al., 2004).
Thus, the average value of
0.85 W/m² for the annual means of the
last 10 years is used
in this study, following Hansen et al. (2005) and Trenberth et
al. (2009).
”, p1926col2mb;
See also Fig 2 p1927t,
B.
Lin et al.: Estimations of climate sensitivity, Feb2010
http://www.atmos-chem-phys.org/10/1923/2010/acp-10-1923-2010.pdf
1. A
basic energy-temperature FUNCTION explaining the machine basics in AGW — there
are (as yet of May2011, and as far as I know) no SPECIFIC established sources
on this point; the AGW-proof here is based on the general transient function
described in Man Made Global Warming. The same type can however be found as
a SIMULATION (research groups use it) in association with the established GISS-curve
(same type as the NASA-curve) as in B. Lin et al 2010 (p1927 Fig 2).
2. The
surface oceanic periods — detailed descriptions (but as yet no general
agreement due to the great difficulties of observation and general theory) on
web sites are found at
http://icecap.us/docs/change/OceanMultidecadalCyclesTemps.pdf
ICECAP (International Climate and Environmental
Change Assessment Project 2007-2008),
Ocean Multi-Decadal Changes and
Temperatures, Joseph D'Aleo;
Authors references are found at
http://icecap.us/index.php/go/experts
3. The
sum of (1) and (2) as the observed land-marine global warming curve as (the NASA-curve) presented at
http://climate.nasa.gov/keyIndicators/
http://www.cru.uea.ac.uk/cru/info/warming/
4. The
anthropogenic energy-function from (1) [described here in Man Made Global Warming] corresponding to (what the absorbing
ocean sees of)
5. the
industrial Fossil-Carbon emission curve as presented at
http://commons.wikimedia.org/wiki/File:Global_Carbon_Emission_by_Type_to_Y2004.png
http://www.renewableenergy.typepad.com/
6. The
integral function of (5, and hence 4 [and thus 1]) as the corresponding
Carbon-Dioxide Concentration curve as presented at
http://en.wikipedia.org/wiki/Greenhouse_gas
http://en.wikipedia.org/wiki/File:Carbon_History_and_Flux_Rev.png
(The integral solution to this one is a
challenge, my experience to note: no web serving solution has yet been found —
numerical methods must be consulted to find a match …. Se details [in the
Swedish edition] in The E-Integral
http://www.universumshistoria.se/AGW.htm -
INTEGRALKURVANförE
).
7. The
derivative of (4) or The NET EFFECT curve (Power per square meter, W/M²) from
AGW. Details in The Effect(Power)Curve
http://www.universumshistoria.se/AGWbeviset.htm -
Effektkurvan
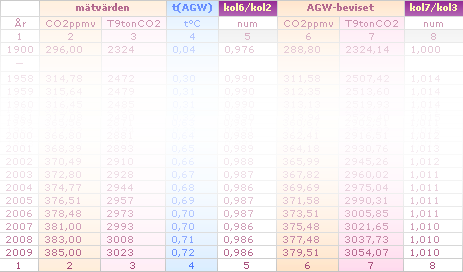
CO2-halterna, se Tabellvärden i
http://www.universumshistoria.se/AGW.htm -
TabellvärdenCO2
About
BellDharma
Systematic governmental (western world)
tracking down persons with punishments and general mistreats because of their
conviction in refusal to take any part in organized violence as a tool of
reaching any kind of progress in the family of humanity, have caused this
author to choose an anonymous acronym. This might not be so much for self
protection from the public, as already experienced and its harassments, but in
respecting other individuals around in the neighborhood and their right for
privacy. It is not my intention to promote any kind of intrusive behavior if I
can prevent it (there have been threats of murder).
I know some (many) persons strongly dislike the appearance of anonymous
authoring, claiming typically »you get most respect if you appear with your own
name». I believe that is not, really, the truth of the matter. According to my
experience, we find respect, solidity and honorability where we find
credibility in an argument, not by peering in the name of the person sending
the message. It is the argument that counts, not the person. (That is why love
and peace lasts eternally while the actors in person inevitably die around the
honey).
Persons, hence, claiming anonymous appearances to be LESS in value,
hence and by me also render a LESS credibility in the family of humanity. It is
always a matter of nameless choice: you decide for yourself which way you want
it. Fire off the argument, and stay firmly to defend your position. Admit when
you are right, and admit again when you are wrong. Be courteous — without being
dishonest as to your personal opinion (let it out, let it fly on its own
wings). That is how we grow in admiration, as I have experienced.
SpellChecked
4Jul2011
This page Latest
Updated Version 2011-07-14 | YearMonthDayTime
WebPage
Launched 4Jul2011 by BellDharma
*